Wake Up Well: England's Most
Sleep-Deprived Regions
Blinds Direct
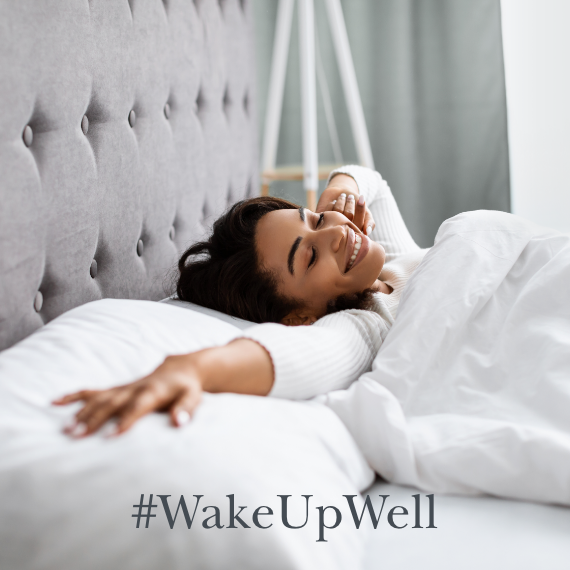
Wake Up Well
Good quality sleep is important for our mental and physical wellbeing, concentration and stress levels - but did you know that much of England needs some extra help getting a solid night’s rest?
England's Most Sleep-Deprived Regions
The most sleep-deprived parts of England have been revealed in our brand-new study, that highlights which regions and major cities are most likely to experience poor quality sleep due to a higher exposure to light and discomfort caused by temperature.
When light pollution, daylight hours and average temperatures are considered across regions in England, the study found that Greater London reports the highest likelihood of sleep disruption, while the North East is the least likely region to have sleep quality impacted by light or discomfort.
On a city-level basis, it’s still the south that suffers, as Central London ranks the highest for the most disrupted sleep, while Newcastle-Upon-Tyne is the least likely to experience any sleep disruption.
Most Disrupted Region
Based on Noise, Light, and Comfort

Most Disrupted Cities
Based on Noise, Light, and Comfort

Light Pollution: The Impact on Sleep Quality
Artificial light is known to disrupt our sleep-wake-cycles. This is unfortunate, as night skies in major urban areas are subject to higher levels of light pollution which makes it harder to sleep well.
Using UK climate averages and light pollution data, the study determined which parts of England are the most likely to experience sleep disruption due to light exposure. The findings were as follows:
- Greater London is the region that suffers the most from light exposure - likely due to its far higher levels of light pollution
- The North East comes out on top as the region least likely to experience sleep disruption caused by light
When it comes to the largest cities in each region, Norwich comes second for the most light disruption behind Central London, followed by Birmingham and Brighton. Leeds is the least disrupted city overall.
These findings were based on the annual sun hours in each region and city, as reported by the MET Office, and average brightness values pulled from the Earth Observation Group. Sun hours is a climatological indicator that illustrates the physical quantity of sunshine in a given area, and is represented by the MET Office as hours per year.
Most Light Pollution
By Region

Breakdown
|
Region
(England)
|
Light Pollution
Average Brightness Value
|
Daylight
Annual Sun Hours
|
|---|---|---|
| Greater London | 30.53 | 1,828 |
| South East | 2.75 | 1,860 |
| East of England | 2.01 | 1,790 |
| West Midlands | 3.26 | 1,635 |
| East Midlands | 2.35 | 1,648 |
| North West | 3.86 | 1,597 |
| Yorkshire and the Humber | 3.16 | 1,639 |
| South West | 1.25 | 1,728 |
| North East | 3.22 | 1,596 |
Most Light Pollution
By City

Breakdown
|
Cities
(England)
|
Light Pollution
Average Brightness Value
|
Daylight
Annual Sun Hours
|
|---|---|---|
| Central London | 70 | 1,828 |
| Norwich | 22 | 1,877 |
| Brighton | 11 | 1,909 |
| Birmingham | 26 | 1,645 |
| Bristol | 10 | 1,759 |
| Leicester | 22 | 1,638 |
| Manchester | 41 | 1,552 |
| Leeds | 15 | 1,500 |
| Newcastle upon Tyne | 25 | 1,474 |
Discomfort: The Impact on Sleep Quality
There are many factors that cause discomfort when trying to sleep, including stress, caffeine intake and mattress quality. However, one of the most impactful factors on sleep quality is temperature.
Based on climate data, the study also pinpointed which parts of England see the worst sleep quality due to high average temperatures and fluctuations in heat. The findings were:
- The East of England sees the highest average temperatures and the most fluctuation, making it the region most affected by discomfort
- Meanwhile, the North East sees the least fluctuation in heat and the lowest temperatures.
At city-level, Central London reports the highest average temperatures and the broadest fluctuation, while Newcastle-Upon-Tyne is the least disrupted overall.
These conclusions were drawn based on MET Office data on average daily temperatures, mean minimum daily temperatures, and mean maximum daily temperatures.
Most Discomfort
By Region

Discomfort Breakdown
By Temperature
|
Region
(England)
|
Average Daily
˚C
|
Mean Minimum
Daily ˚C
|
Mean Maximum
Daily ˚C
|
|---|---|---|---|
| East Of England | 11 | 6.7 | 14.9 |
| Greater London | 12.2 | 8 | 15.9 |
| South East | 11.3 | 7 | 15 |
| West Midlands | 10.5 | 6.3 | 14.4 |
| East Midlands | 10.4 | 6.2 | 14 |
| South West | 11 | 7.4 | 14.6 |
| Yorkshire and the Humber | 10 | 6.2 | 13.9 |
| North West | 10 | 6.4 | 13.4 |
| North East | 8.8 | 5.2 | 12.4 |
Most Discomfort
By City

Discomfort Breakdown
By Temperature
|
Region
(England)
|
Average Daily
˚C
|
Mean Minimum
Daily ˚C
|
Mean Maximum
Daily ˚C
|
|---|---|---|---|
| Central London | 12.2 | 8 | 15.9 |
| Norwich | 10.8 | 6.8 | 14.8 |
| Bristol | 11.3 | 7.3 | 15 |
| Brighton | 11.5 | 7.9 | 14.6 |
| Leicester | 10.4 | 6 | 14.3 |
| Birmingham | 10.7 | 6.7 | 14.4 |
| Manchester | 10.9 | 7.3 | 14.2 |
| Leeds | 10.2 | 6.3 | 13.9 |
| Newcastle upon Tyne | 10.2 | 6.8 | 13.7 |
So, What's
The Secret to a Good Night's Sleep?
Even in areas that report low levels of disruption due to light and discomfort, poor sleep quality can also be aggravated by longer working hours, or other external factors outside of our direct control.
In fact, the study found that as well as reporting the highest levels of light pollution and temperature fluctuations, Central London is the most overworked city based on average working hours per week, while Newcastle boasts the best work/life balance.
Whether you work regular night shifts as a driver, health care professional, or security personnel, you can rest assured there are steps you can take to increase the chances of you getting a good night’s sleep, aside from cutting down on work.
The most important thing to do is identify which variable is making it hard for you to sleep - whether it’s environmental noise, light pollution or discomfort - and take steps to mitigate it. You can do this in a variety of ways including investing in a quality blackout blind, wearing earplugs or sleeping with the window open.
To help you improve the quality of your sleep, we asked some experts for their top tips. Here’s what they said:
1.
Establish a schedule, and stick to it.
Allana Wass, Certified Sleep Science Coach, says: “Staying consistent with your sleep schedule is essential. It might be hard to go to bed and wake up at the same time, but only at first. Once your body adjusts to a specific schedule, you won’t even have to catch up on sleep during the weekends. The thing is, sticking to a sleep schedule will allow your body to regulate its natural sleep and wake cycles easier. And with time, you will find it easier to fall asleep and wake up naturally.”
2.
Make your room as dark as possible.
Alex Savy, Certified Sleep Science Coach and Founder of SleepingOcean, says: “To improve one’s sleep quality, you need to control light exposure. Try to get enough daylight by sitting near the window during work or taking walks whenever you can (even on a foggy day, it still might do you some good). Additionally, you might want to limit your screen time and, ideally, avoid taking devices to bed. You can use a blue light filter in the evening for extra protection and dim the lights around the house a couple of hours before bedtime.”
3.
Follow a strict WFH bedtime routine.
Katherine Hall, UK-based Sleep Psychologist and Sleep Coach, urges Brits to prioritise getting a good night’s rest to reduce disruption caused by returning to the office. She says:
“If you have been routinely waking up slightly later since working from home, you may find waking up slightly earlier more difficult. With more and more people working from home during the pandemic, the line between ‘work’ and ‘home’ has become a lot blurrier. This may have led to excessive time spent in front of your phone, delaying sleep and impacting sleep quality. However, returning to work could provide that much-needed barrier between work and home."
Regardless of where you might live, it’s clearly important that you get the rest you deserve after a busy day. With light playing such a major role in affecting our sleep, you can significantly benefit from blocking out unwanted light with a high-quality blackout blind.
To find out how blackout blinds can improve the quality of your sleep, you can read The Benefits Of Blackout Blinds blog or contact us directly.
Most Overworked Major Cities
Ranked From Most to Least

Breakdown
Ranked From Most To Least
|
Cities
(England)
|
Workers
(Aged 16-64)
|
Unpaid Overtime
Proportion (%)
|
AVG. Hours*
Per Week
|
Paid OverTime Hours
Avg. Per Week
|
AVG. Hours*
Avg. Per Week
|
|---|---|---|---|---|---|
| Central London | 1,010,000 | 24.4 | 37.8 | 0.6 | 7.8 |
| Brighton | 160,000 | 20.5 | 38.1 | 0.8 | 7.3 |
| Bristol | 249,400 | 19.9 | 38.3 | 0.9 | 7 |
| Norwich | 80,000 | 18.6 | 38.3 | 1.1 | 7.3 |
| Leeds | 426,900 | 18 | 38.1 | 1.1 | 7.3 |
| Leicester | 178,500 | 17.5 | 38.3 | 1.1 | 7.5 |
| Birmingham | 497,000 | 17.6 | 38.3 | 1 | 7.6 |
| Manchester | 256,300 | 15.3 | 37.9 | 1 | 8 |
| Newcastle Upon Tyne | 140,400 | 14 | 37.8 | 1.2 | 7.3 |
Education
|
Cities
(England)
|
Workers*
(Aged 16-64)
|
Average Hours Worked
Per Week
|
Total Hours
Worked
|
|---|---|---|---|
| Central London | 109,080 | 25.5 | 33.9 |
| Brighton | 17,280 | 25.5 | 33.6 |
| Bristol | 26,935 | 25.5 | 33.4 |
| Norwich | 8,640 | 25.5 | 33.9 |
| Leeds | 46,105 | 25.5 | 33.9 |
| Leicester | 19,278 | 25.5 | 34.1 |
| Birmingham | 53,676 | 25.5 | 34.1 |
| Manchester | 27,680 | 25.5 | 34.5 |
| Newcastle Upon Tyne | 15,163 | 25.5 | 34 |
Health and Social Care
|
Cities
(England)
|
Total Hours Worked
|
Number of Workers
|
Average Base Hours
Worked
|
|---|---|---|---|
| Central London | 136,350 | 29.1 | 37.5 |
| Brighton | 21,600 | 29.1 | 37.2 |
| Bristol | 33,669 | 29.1 | 37 |
| Norwich | 10,800 | 29.1 | 37.5 |
| Leeds | 57,632 | 29.1 | 37.5 |
| Leicester | 24,098 | 29.1 | 37.7 |
| Birmingham | 67,095 | 29.1 | 37.7 |
| Manchester | 34,601 | 29.1 | 38.1 |
| Newcastle Upon Tyne | 18,954 | 29.1 | 37.6 |
What have we
learned?
Based in Huddersfield, we of course know Yorkshire is the best place to live in the world, but there are some considerations we should all be aware of when it comes to where we live, and how it affects our sleep.
Despite London, Newcastle and Leeds dominating the highest and lowest positions across each ranking, it’s surprisingly Norwich - when you consider its population and level of light pollution - that reports the highest brightness value per capita. Other cities with notably high light pollution levels also include Manchester and Leicester.
This demonstrates that London may be the worst affected city in England, but also that many living in our urban areas especially could benefit from some easy steps to mitigate the effects of light and temperature.
The Blinds Direct #WakeUpWell study uses data from the Met Office, Office for National Statistics, Earth Observation Group and the World Health Organization.

Can't Find What You're Looking For?
Call or send us an email and a member of our Customer Service team will be happy to help.
Our Telephone lines are open Mon - Friday 8:30AM - 6PM
Live chat is available Mon - Fri 9AM - 5PM and Saturday & Sunday 10AM - 4PM
Please note, we are closed on bank holidays
Expected wait times:
Click Here >>
Click Here >>
Average wait: 30 Seconds
Enquire Here >>
Average wait: 3 Days
01924 481729
Average wait: 5 Minutes